Sage 100 offers some basic financial statements, but occasionally users need something a little different. Besides the standard Balance Sheet, Income Statement, and Statement of Cash Flows, users can create customizations of these as well as to create Trend or Quarterly Reports. Creating these customizations is not difficult, and it allows for more robust reporting than is offered by default.
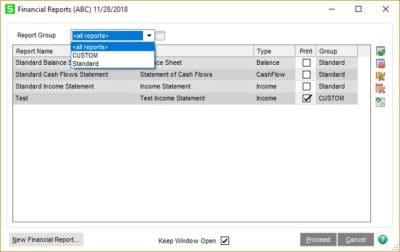
To get started, access Financial Reports under General Ledger > Reports. If no other reports have been customized, you’ll be presented with the three default reports.
These default reports cannot be customized in and of themselves. However, by clicking on the New Financial Report button in the lower-left corner, you will soon be on your way to setting up your own variations of these reports. A wizard will open and walk you through the selection process.
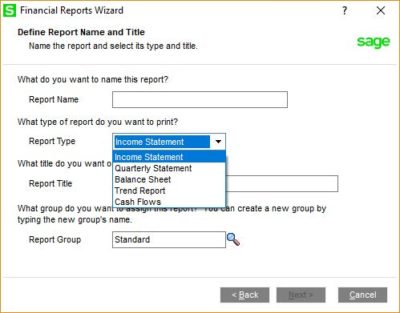
First, specify a Report Name.
The Income Statement is a typical presentation of Revenue and Expense. A Quarterly Statement is an income statement that reports by quarter or periods within a specific quarter. The Balance Sheet is the presentation of Assets, Liabilities, and Equity. A Trend Report will present income information across “rolling” periods, e.g. the current period and the past 11 periods for a 12-month income statement. The Cash Flows report shows how cash is used through a period to reconcile beginning cash to ending cash.
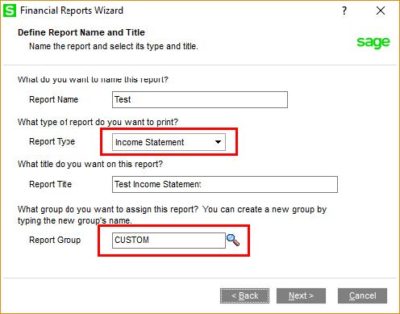
Select a Report Type from the above. Give the report a title and assign it to a Group. The Standard group is offered by default, but reports can be assigned to alternate groups as desired.
Let’s select the Income Statement and put it in a new group.
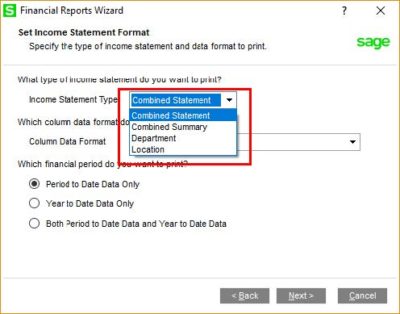
Now let’s specify what kind of statement we want.
A Combined Statement is the default format that lists every account associated with Revenue or Expenses. The Combined Summary will “roll-up” subaccounts to the main account. If you’re using account segments, you can use this as a quick “summary” of the overall revenues and expenses. You will note the Department and Location as additional options. These relate to defined subaccount segments and won’t be visible if you’re only relying on a single GL segment.
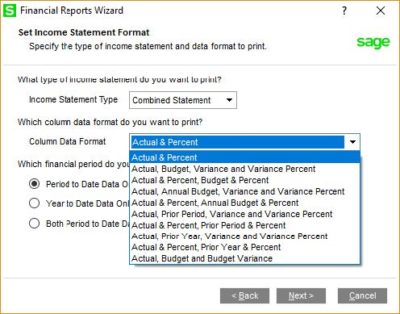
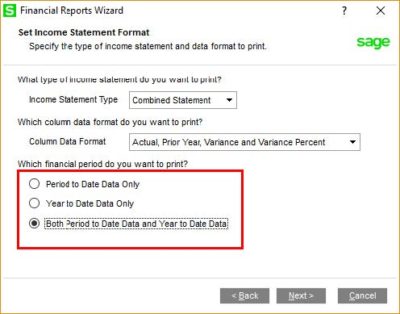
Identify the columns you want in your report. Then identify if you want Period to Date, Year to Date, or both to be presented.
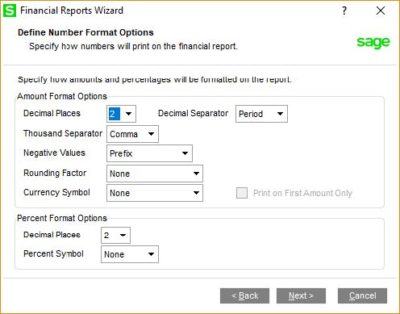
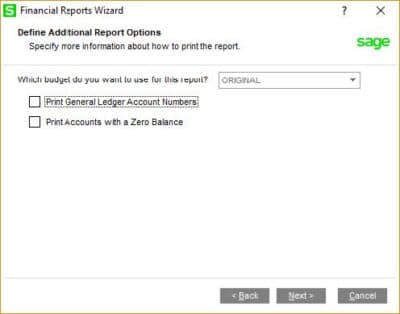
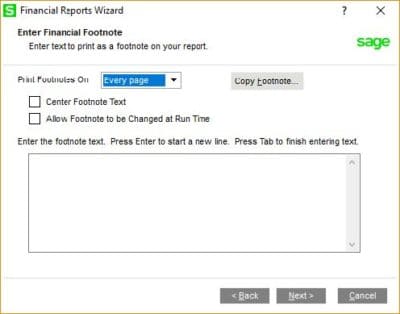
Specify numeric formats. If you’re using budgeted statements, select which budget to report. Also, indicate if you want to see the GL account numbers and accounts with zero balance for the period reported. Then indicate if you need footnotes and enter the text to be printed.
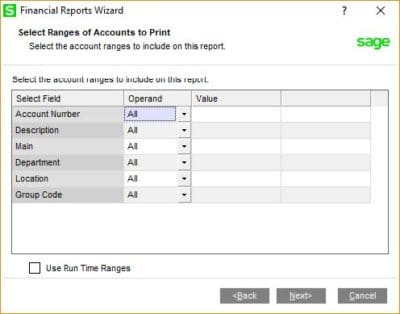
Specify fixed ranges or whether you want to specify criteria at run time.
At the end of the Wizard, you will be prompted to run the report if you wish. Otherwise, you can return to the Financial Reports screen where you can filter by report group or simply select the report(s) you want to run.
Click Proceed to generate the report(s).
Within a matter of minutes, it’s possible to set up a new report format. If you need more complex reporting capabilities, there are various options, including Sage Intelligence or Power BI reporting.
For more information or assistance with customizing standard financial statements, contact our Sage 100 support team at 800.232.8913.
Register for our Sage 100 newsletter today!


